ISSS608 Visual Analytics
Assignment
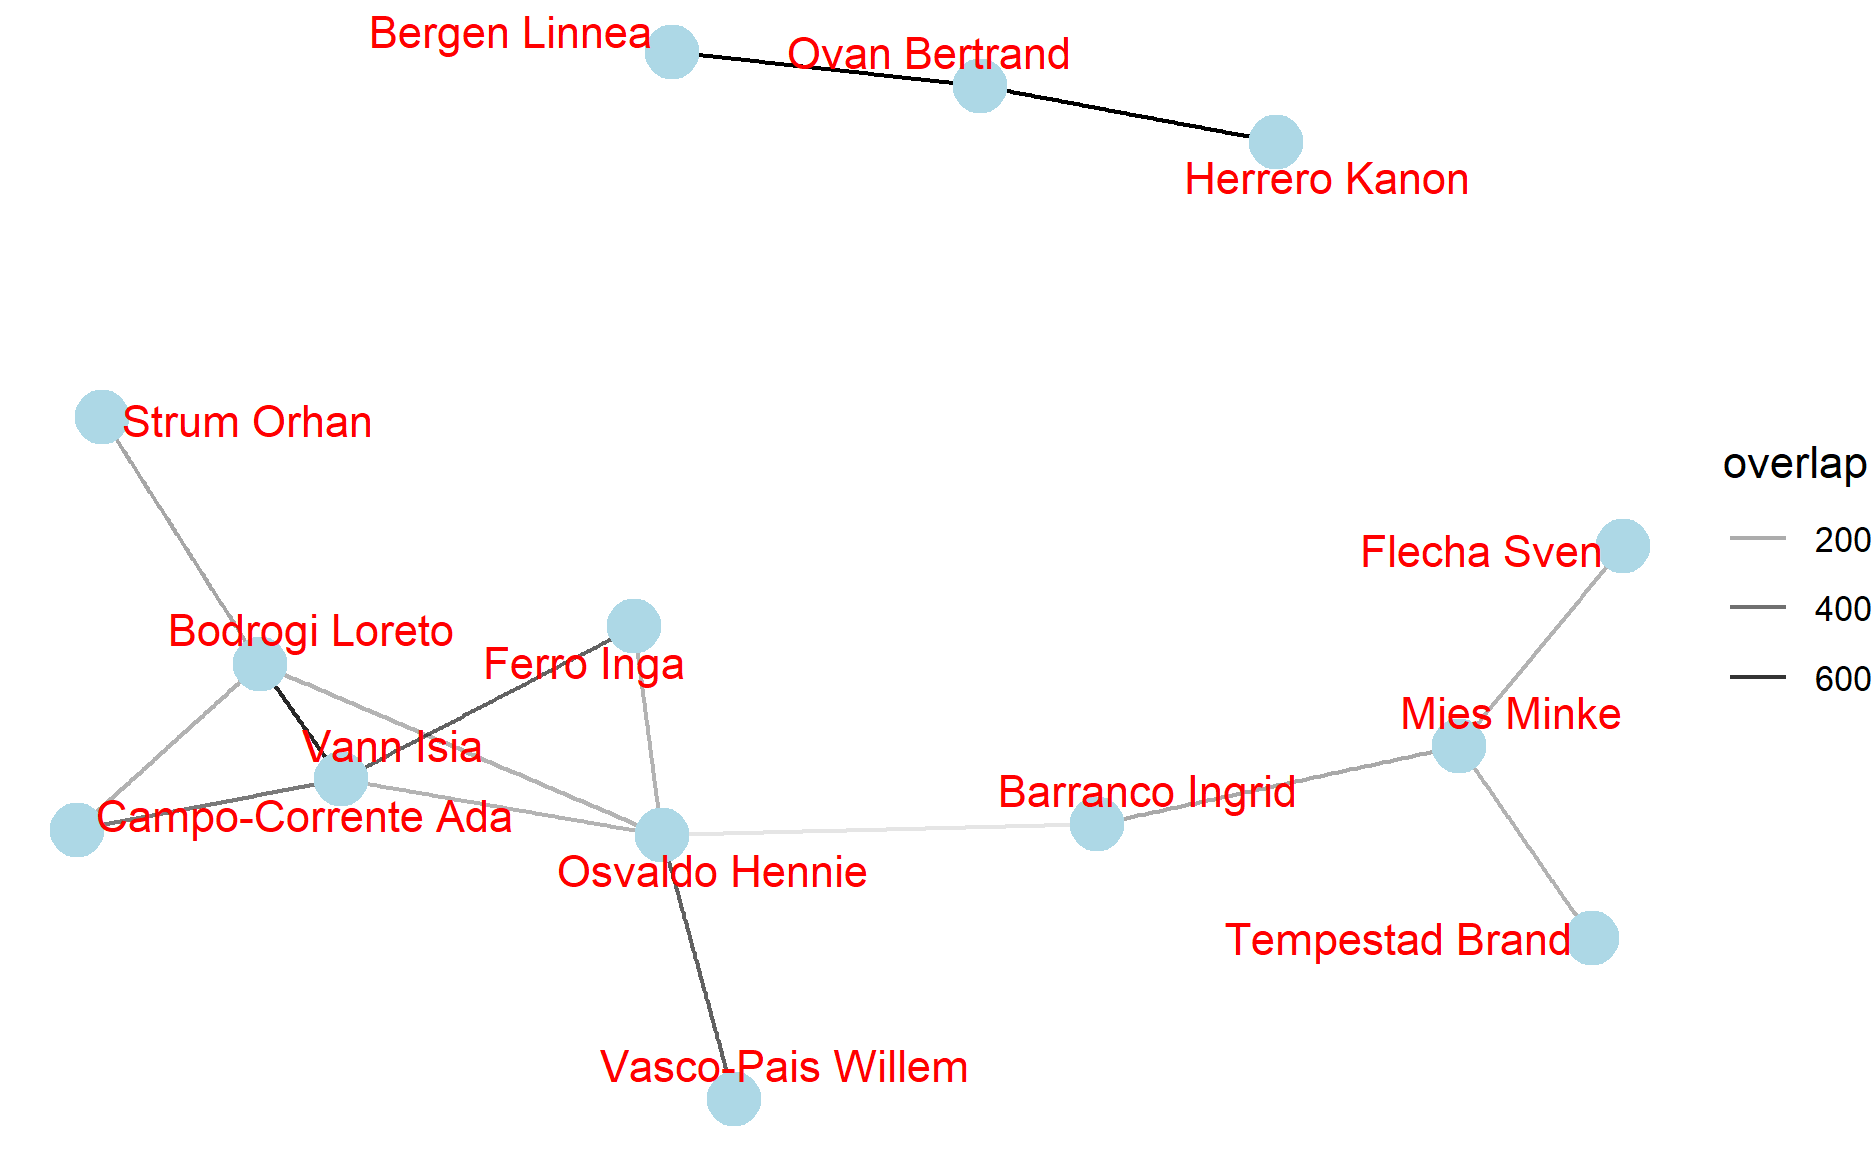
I use interactive visual techniques using R to solve [mini-challenge 2 of the 2021 Vast Challenge](https://vast-challenge.github.io/2021/MC2.html).
DataViz Makeover 2
In this post, I share how I used Tableau to redesign a graphic to improve its clarity and aesthetics. I introduce interactivity through the use of filters, tooltips, and animation.
DataViz Makeover 1
In this post, I share how I used Tableau to redesign a graphic to improve its clarity and aesthetics.
Welcome to Kevin's ISSS608 Visual Analytics Blog
Welcome to my blog, ISSS608 Visual Analytics. I hope you enjoy reading what I have to say!